Skip to content

Examples

The examples and translations below are intended to showcase dyce’s flexibility. Links to more advanced examples appear at the bottom.

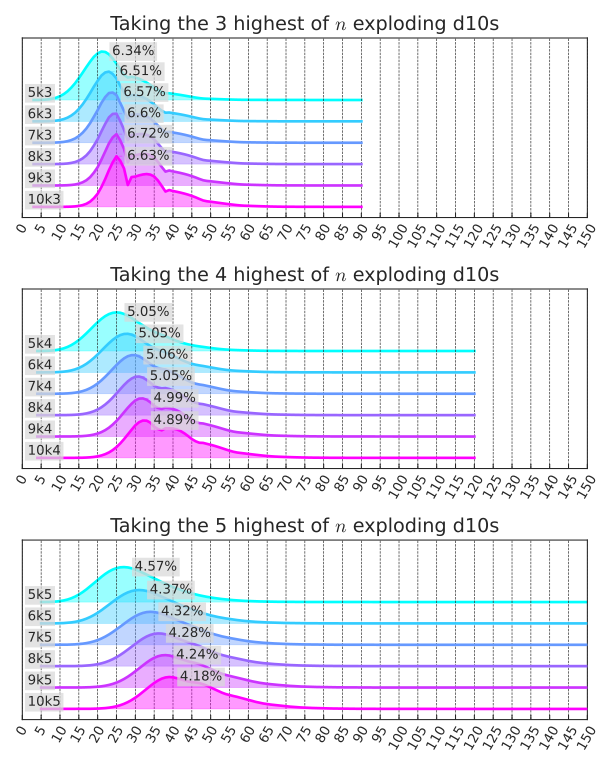
Translation of the accepted answer to “Roll and Keep in Anydice?”

Original AnyDice source:

1
2
\ How best to model this in a way that allows testing 1k1 to 10k5? \
output [highest 3 of 10d [explode d10]] named "10k3"

dyce translation:

 1
 2
 3
 4
 5
 6
 7
 8
 9
10
11
12
from dyce import H, P, explode_n
from dyce.d import d10

explode_depth = 2
exploded_d10 = explode_n(d10, n=explode_depth)

def keep(p: P[int], k: int) -> H[int]:
    r"Negative k keeps lowest, otherwise keeps highest"
    return p.at(slice(-k, None) if k > 0 else slice(-k))

def nkk(n: int, k: int) -> H[int]:
    return keep(n @ P(exploded_d10), k=k)
Visualization source code
 1
 2
 3
 4
 5
 6
 7
 8
 9
10
11
12
13
14
15
16
17
18
19
20
21
22
23
24
25
26
27
28
29
30
31
32
33
34
import matplotlib.pyplot as plt
import matplotlib.ticker as mticker

from dyce.viz.matplotlib import plot_ridge

k_start, k_end = 3, 6  # range: [start_k..end_k)
n_start, n_end = 5, 11  # range: [start_n..end_n)
rows_by_k = {
    k: [(f"{n}k{k}", nkk(n, k)) for n in range(n_start, n_end)]
    for k in range(k_start, k_end)
}
max_x = max(max(h) for rows in rows_by_k.values() for _, h in rows)
max_y = max(
    float(prob)
    for rows in rows_by_k.values()
    for _, h in rows
    for _, prob in h.probability_items()
)
for k, rows in rows_by_k.items():
    labels, hs = zip(*rows, strict=True)
    ax = plt.subplot2grid((k_end - k_start, 1), (k - k_start, 0))
    plot_ridge(*hs, labels=labels, cmap="cool", peak=max_y, ax=ax)
    for line in ax.lines:
        line.set_marker("")
    ax.xaxis.set_major_locator(mticker.MultipleLocator(5))
    ax.tick_params(axis="x", labelrotation=60)
    ax.set_title(f"Taking the {k} highest of $n$ exploding d10s")
    ax.set_xlim(left=0, right=max_x)  # subplots should share a horizontal scale
# subplots should share a vertical scale
axes = plt.gcf().get_axes()
y_lims = [ax.get_ylim() for ax in axes]
for ax in axes:
    ax.set_ylim(min(lo for lo, _ in y_lims), max(hi for _, hi in y_lims))
plt.gcf().set_size_inches(6.4, 8.0)

Plot: Taking the *k* highest of *n* exploding d10s

Interactive version: Try <code>dyce</code>!

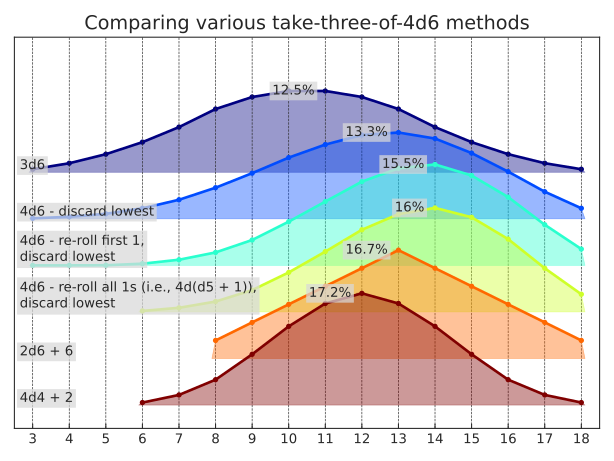
Modeling “The Probability of 4d6, Drop the Lowest, Reroll 1s”

 1
 2
 3
 4
 5
 6
 7
 8
 9
10
11
12
13
14
15
16
17
18
19
20
21
22
from dyce import H, P, expand

p_4d6 = 4 @ P(6)
d6_reroll_first_one = expand(
    lambda result: result.h if result.outcome == 1 else result.outcome,
    H(6),
)
p_4d6_reroll_first_one = 4 @ P(d6_reroll_first_one)
p_4d6_reroll_all_ones = 4 @ P(H(5) + 1)

attr_results: dict[str, H[int]] = {
    "3d6": 3 @ H(6),
    "4d6 - discard lowest": p_4d6.at(slice(1, None)),
    "4d6 - re-roll first 1,\ndiscard lowest": p_4d6_reroll_first_one.at(
        slice(1, None)
    ),
    "4d6 - re-roll all 1s (i.e., 4d(d5 + 1)),\ndiscard lowest": p_4d6_reroll_all_ones.at(
        slice(1, None)
    ),
    "2d6 + 6": 2 @ H(6) + 6,
    "4d4 + 2": 4 @ H(4) + 2,
}

Visualization:

1
2
3
4
5
from dyce.viz.matplotlib import plot_ridge

labels, hs = zip(*attr_results.items(), strict=True)
ax = plot_ridge(*hs, labels=labels, cmap="jet")
ax.set_title("Comparing various take-three-of-4d6 methods")

Plot: Comparing various take-three-of-4d6 methods

Interactive version: Try <code>dyce</code>!

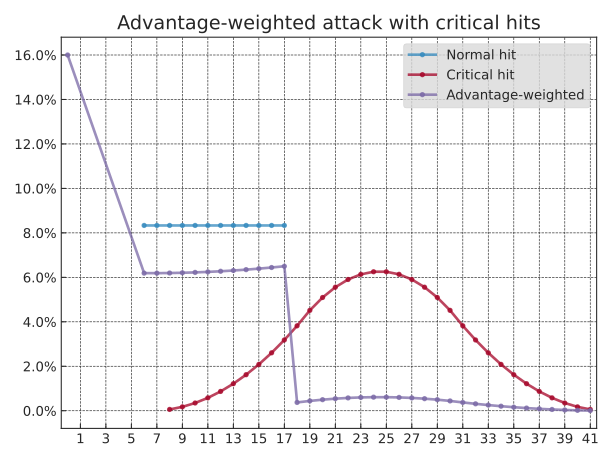
Attack damage with advantage and critical hits

Original LordSembor/DnDice example source:

 1
 2
 3
 4
 5
 6
 7
 8
 9
10
11
12
13
14
15
from DnDice import d, advantage, plot

normal_hit = 1*d(12) + 5
critical_hit = 3*d(12) + 5

result = d()
for value, probability in advantage():
  if value == 20:
    result.layer(critical_hit, weight=probability)
  elif value + 5 >= 14:
    result.layer(normal_hit, weight=probability)
  else:
    result.layer(d(0), weight=probability)
result.normalizeExpectancies()
# …

dyce translation:

 1
 2
 3
 4
 5
 6
 7
 8
 9
10
11
12
13
14
15
from dyce import H, HResult, P, expand

normal_hit = H(12) + 5
critical_hit = 3 @ H(12) + 5
advantage = (2 @ P(20)).at(-1)

def crit(result: HResult[int]) -> H[int] | int:
    if result.outcome == 20:
        return critical_hit
    elif result.outcome + 5 >= 14:
        return normal_hit
    else:
        return 0

advantage_weighted = expand(crit, advantage)

Visualization:

 1
 2
 3
 4
 5
 6
 7
 8
 9
10
11
12
13
import matplotlib.ticker as mticker

from dyce.viz.matplotlib import plot_line

ax = plot_line(
    normal_hit,
    critical_hit,
    advantage_weighted,
    labels=["Normal hit", "Critical hit", "Advantage-weighted"],
)
ax.xaxis.set_major_locator(mticker.IndexLocator(base=2, offset=1))
ax.set_title("Advantage-weighted attack with critical hits")
ax.legend()

Plot: Advantage-weighted attack with critical hits

Interactive version: Try <code>dyce</code>!

Translation of the accepted answer to “Modelling opposed dice pools with a swap”

Original AnyDice source of basic brawl:

1
2
3
4
5
6
7
8
9
function: brawl A:s vs B:s {
  SA: A >= 1@B
  SB: B >= 1@A
  if SA-SB=0 {
    result:(A > B) - (A < B)
  }
  result:SA-SB
}
output [brawl 3d6 vs 3d6] named "A vs B Damage"

Translation:

1
2
3
4
5
>>> from dyce.evaluation import PResult
>>> def brawl(p_result_a: PResult[int], p_result_b: PResult[int]) -> int:
...     a_successes = sum(1 for v in p_result_a.roll if v >= p_result_b.roll[-1])
...     b_successes = sum(1 for v in p_result_b.roll if v >= p_result_a.roll[-1])
...     return a_successes - b_successes

Rudimentary textual visualization using built-in methods:

 1
 2
 3
 4
 5
 6
 7
 8
 9
10
11
12
13
>>> from dyce import P, expand
>>> from dyce.d import p3d6
>>> res = expand(brawl, p3d6, p3d6)
>>> print(res.format(width=65))
avg |    0.00
std |    1.73
 -3 |   7.86% |###
 -2 |  15.52% |#######
 -1 |  16.64% |########
  0 |  19.96% |#########
  1 |  16.64% |########
  2 |  15.52% |#######
  3 |   7.86% |###

Original AnyDice source of brawl with an optional dice swap:

 1
 2
 3
 4
 5
 6
 7
 8
 9
10
11
12
13
14
15
16
17
function: set element I:n in SEQ:s to N:n {
  NEW: {}
  loop J over {1 .. #SEQ} {
    if I = J { NEW: {NEW, N} }
    else { NEW: {NEW, J@SEQ} }
  }
  result: NEW
}
function: brawl A:s vs B:s with optional swap {
  if #A@A >= 1@B {
    result: [brawl A vs B]
  }
  AX: [sort [set element #A in A to 1@B]]
  BX: [sort [set element 1 in B to #A@A]]
  result: [brawl AX vs BX]
}
output [brawl 3d6 vs 3d6 with optional swap] named "A vs B Damage"

Translation:

 1
 2
 3
 4
 5
 6
 7
 8
 9
10
11
12
13
14
>>> def brawl_w_optional_swap(p_result_a: PResult[int], p_result_b: PResult[int]) -> int:
...     roll_a, roll_b = p_result_a.roll, p_result_b.roll
...     if roll_a[0] < roll_b[-1]:
...         roll_a, roll_b = roll_a[1:] + roll_b[-1:], roll_a[:1] + roll_b[:-1]
...         # Sort greatest-to-least after the swap
...         roll_a = tuple(sorted(roll_a, reverse=True))
...         roll_b = tuple(sorted(roll_b, reverse=True))
...     else:
...         # Reverse to be greatest-to-least
...         roll_a = roll_a[::-1]
...         roll_b = roll_b[::-1]
...     a_successes = sum(1 for v in roll_a if v >= roll_b[0])
...     b_successes = sum(1 for v in roll_b if v >= roll_a[0])
...     return a_successes - b_successes or (roll_a > roll_b) - (roll_a < roll_b)

Rudimentary visualization using built-in methods:

1
2
3
4
5
6
7
8
9
>>> res = expand(brawl_w_optional_swap, p3d6, p3d6)
>>> print(res.format(width=65))
avg |    2.36
std |    0.88
 -1 |   1.42% |
  0 |   0.59% |
  1 |  16.65% |########
  2 |  23.19% |###########
  3 |  58.15% |#############################
 1
 2
 3
 4
 5
 6
 7
 8
 9
10
11
12
>>> p4d6 = 4 @ P(6)
>>> res = expand(brawl_w_optional_swap, p4d6, p4d6)
>>> print(res.format(width=65))
avg |    2.64
std |    1.28
 -2 |   0.06% |
 -1 |   2.94% |#
  0 |   0.31% |
  1 |  18.16% |#########
  2 |  19.97% |#########
  3 |  25.19% |############
  4 |  33.37% |################

Advanced deep dives

Double-secret advanced deep dive

Experts only. Closed course.